


Rates as of 06:30 GMT
Market Recap
Well, I got it part of it right – the RBNZ did indeed raise the Official Cash Rate (OCR) by 50 bps, as I thought they would, and for exactly the reason I thought they would: “The Committee agreed that their policy ‘path of least regret’ is to increase the OCR by more now, rather than later, to head off rising inflation expectations…”
So we come back to that old question they always ask economists: if you’re so smart, why aren’t you rich? In this case it’s because although I got the RBNZ’s actions right, I got the market reaction entirely wrong! The market reaction was the opposite of what I had expected, unfortunately, and that’s what matters.
NZD/USD rose notably ahead of the announcement – could it be that someone got wind of it a few minutes beforehand? – but then collapsed immediately afterward. Why?

Because this hike did not represent any change in the path of interest rates, only the pace of change. “The Committee remained comfortable with the outlook for the OCR as outlined in their February Monetary Policy Statement,” they said. All they were doing is bringing future rate hikes forward. As such, the Feb. 2023 implied OCR actually fell to 3.36% from 3.54% yesterday on the assumption that hiking more now means less need for hiking in the future.

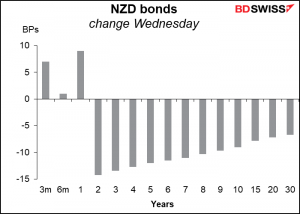
In line with that way of thinking, NZD bond yields out past 1 year fell, with the policy-sensitive 2-year yield down a particularly sharp 14 bps.
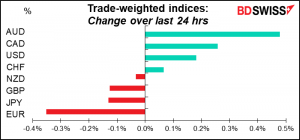
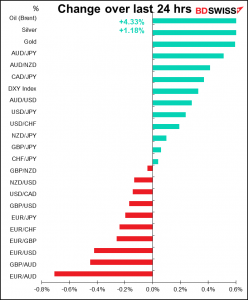
AUD and CAD however strengthened as oil prices turned higher again. Meanwhile EUR fell and EUR/CHF continued to creep toward parity. The reason behind those moves was Putin’s comments that peace talks with Ukraine had “again returned to a dead-end situation.”
Nonetheless, bond yields generally fell as US core inflation surprised on the downside. As you can see from the table above, while headline inflation was in line with market expectations on a mom basis and in fact a shade higher yoy, US core inflation was lower than expected at +0.3% mom (vs. +0.5% expected). That reduced expectations for Fed tightening this year by around 10 bps and helped bond markets to rally (except for CHF, for some reason).

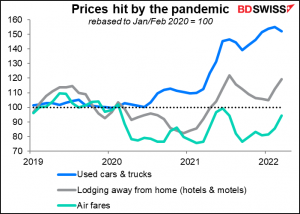
Although the 8.5% yoy rate of increase in the headline US CPI was dramatic, higher gasoline prices (+18.3% mom) were responsible for more than half of the mom increase. On the other hand used cars & trucks, one of the main causes of the surge in inflation last year, were down 3.8% mom, the largest fall since 1969. Such changes leave open the possibility that this higher inflation rate is indeed “transitory,” that once (if?) the war in Ukraine ends and the oil market gets back to normal, inflation may calm down.
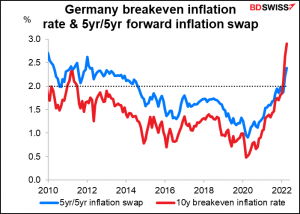
European inflation expectations however continued to rise, setting up a problem for tomorrow’s European Central Bank (ECB) meeting. While the ECB is worried that inflation will be back below target in a few years, the market thinks that even five years from now inflation in Germany will be above target (2.38%). The German 10-year inflation breakeven is at a record high of 2.90% (data back to 2009).
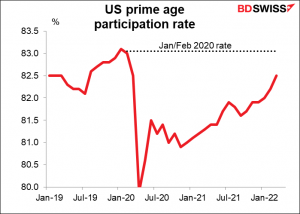
Sad notes: I saw a depressing paper from the US National Bureau of Economic Research (NBER). The paper, “Substance Abuse During the Pandemic: Implications for Labor Force Participation,” looks at the puzzle of why the labor force participation rate – the percent of people able to work who are working or looking for work – has failed to recover after the pandemic even though there are plenty of jobs available. It concludes that “increased substance abuse accounts for between 9 and 26 percent of the decline in prime-age labor-force participation between February 2020 and June 2021.” A stunning conclusion.
Today’s market

Note: The table above is updated before publication with the latest consensus forecasts. However, the text & charts are prepared ahead of time. Therefore there can be discrepancies between the forecasts given in the table above and in the text & charts.
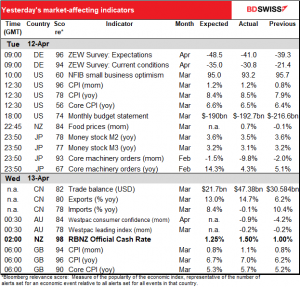
The day started out with UK consumer price index (CPI), which was significantly higher than expected, as shown in the first table.
Then we get the US producer price index (PPI). Following on from Tuesday’s elevated US CPI, the PPI should confirm that price pressures are intensifying. Although note that the yoy forecast for core PPI is unchanged, which might suggest a peak, in line with the lower-than-expected core CPI.
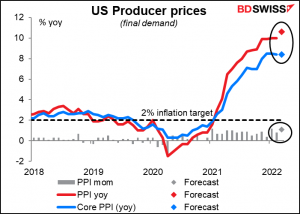
That’s pretty much true if we look at the three-month change annualized, too. However the headline PPI on that basis is continuing to soar, meaning the worst probably isn’t over yet.
FYI if you’re interested in the relationship between the PPI and the more widely-watched CPI, we have a report on the website about this: The PPI and the CPI: what’s the connection?

Next up is the main event of the day, the Bank of Canada rate decision. As usual, I’ve already gone over this in more detail than anyone can stomach in my Weekly Outlook, so I’ll just repeat the conclusion and some trading points here.
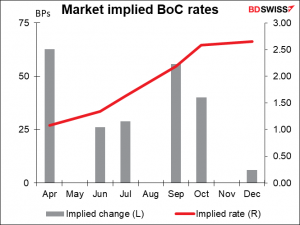
The Bank of Canada is widely expected to hike 50 bps. Out of 29 economists polled by Bloomberg, 23 expect a 50 bps hike to 1.0%. The overnight index swap (OIS) market is even more hawkish – it’s discounting a good chance of a 75 bps hike! (Note that none of the economists polled have forecast this, so it would be a major surprise to the market.)
There’s also the question of what to do about the Bank of Canada’s bloated balance sheet. The Bank of Canada had far and away the most expansive quantitative easing (QE) policy of any of the major central banks – it blew up its balance sheet to almost 5x its pre-pandemic size! This compares with a 114% increase for the Fed and 88% increase for the ECB. Deputy Gov. Kozicki said they would be discussing the start of quantitative tightening (QT), the reversal or unwinding of QE – we can hope to hear some specifics on this topic.

At this point, I think oil prices and the outlook for global growth are probably more important than interest rates in determining USD/CAD. Nonetheless if the market perceives the Bank of Canada as being more hawkish than expected – particularly if they hint at a more rapid reduction in their balance sheet than the Fed – this could help to bolster the currency.
In any case, how does USD/CAD tend to trade after a Bank of Canada meeting? Oddly enough, looking at the last four times that the BoC has announced tightening measures, such as a cut in its bond purchases or a hike in rates, three of these four times USD/CAD has risen – i.e. the Canadian dollar has weakened – after the move. Only in April 2021, when they trimmed their weekly bond purchases to CAD 3bn a week from CAD 4bn, did USD/CAD decline (CAD strengthen) notably.

Looking at the last six times there was no change in policy, the same general response: USD/CAD tended to rise (CAD weakened).
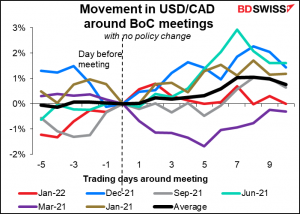
Why is this? I would assume it’s “buy the rumor, sell the fact,” i.e. that people are positioned for the move and take profits afterward. If that’s true, then with a 50 bps hike already priced in and even a chance of 75 bps, it may be hard for the Bank to be more hawkish than the market expects. We could once again see USD/CAD move higher after the announcement.
The key is probably in what they decide about QT – how quickly they decide to run down their balance sheet. That’s one area where the market probably has little to go on and therefore a hawkish surprise is possible.
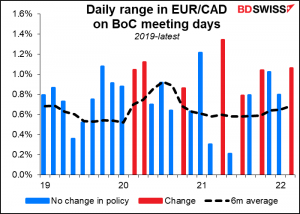
Either way, we’re likely to see a volatile market after the announcement. Historically the range in USD/CAD and EUR/CAD has been much higher on BoC days than on normal days, and especially when they change policy one way or the other.

Then overnight we get the Australian employment data. The Reserve Bank of Australia (RBA) is one of the central banks that has a “dual mandate” that requires it to strive for “the maintenance of full employment in Australia.”
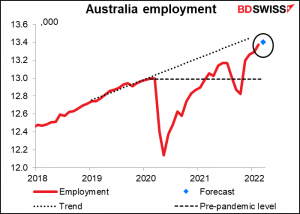
In any case, the labor market certainly isn’t what’s keeping the RBA on the sidelines. The unemployment rate, tied for record low last month, is expected to establish a new record low this month.

Meanwhile employment has long since surpassed the pre-pandemic level and is now approaching the pre-pandemic trendline.
The RBA says it’s concerned about wages growth, not necessarily labor market conditions. Despite forecasting sub-4% unemployment this year and next, a record low level of unemployment, it said in March that “wages growth remains modest and it is likely to be some time yet before growth in labour costs is at a rate consistent with inflation being sustainably at target.” So unlike the US, where the nonfarm payrolls are a major indicator for the market due to its perceived impact on Fed policy, the labor market in Australia apparently can just get tighter and tighter with little impact until wages start to react.
If you want to trade the figures, the most consistent response is that of AUD/NZD to the beat or miss in the unemployment rate. AUD/USD has a statistically insignificant relation to both the change in employment and the unemployment rate, whereas AUD/NZD has little correlation with the change in employment but a decent (not great) correlation with the unemployment rate.


")
